Minye, Helena M., and John R. Merriam. 2001. Induction of P element transposition using D2-3 transposase to determine whether the number of inserts affects transposition rate in Drosophila melanogaster. Dros. Inf. Serv. 84: 70-75.
|
|
|
|||
|
|
||||
Induction
of P element transposition using D2-3 transposase to determine whether
the number of inserts affects transposition rate in Drosophila melanogaster.
Minye, Helena M., and John R. Merriam. Department of Molecular Cell and Developmental Biology, University of California at Los Angeles, 405 Hilgard Avenue, Los Angeles, CA 90095-1606.
Introduction
In Drosophila many different transposons are known, most of them present at variable sites throughout the genome. Transposon movement is a useful tool to geneticists for mutagenesis, for the introduction of genes by using the element as a vector, and to identify endogenous genes by enhancer trapping, most recently extended to gain of function screens (e.g., EP lines). Because of this, there is a strong interest to optimize the movement of elements in this genetic system. One of these mobile genetic sequences is the P element transposon, with its movement controlled by the presence of transposase.
The objective of this study is to establish whether the presence of more than one marked P element is a factor that affects transposition rate. Transposition is a method of transferring genes as transposons to random locations in the genome. There are few known factors that influence transposition rate. One factor is the location of the insert; the same marked element may more readily serve as a source, or template, from one location but infrequently from another location in the genome. Also, size may be an issue, as larger elements are more difficult to transform initially and may reestablish less frequently.
In this study, one P element was marked with y+ and another P element was marked with w+. Both elements are present on the same X chromosome. These marked elements were introduced into the fly by transformation and the movement of these elements was induced by crossing in the D2-3 transposase element located on the third chromosome. “Dysgenic” males with the X linked elements and the D2-3 transposase were crossed to yw females (Figure 1). Relocation of either the w+ marker or the y+ marker from the X chromosome in a male to an autosome in a son is one classic way of recognizing a transposition event. It is often used for enhancer trapping and EP studies. Any marked element on the X chromosome in males will ordinarily pass to their female progeny but none of their male progeny. Those rare sons that inherit their father’s marked element inevitably have it located at a new location on one of the autosomes. The insert is stable if the sons do not receive the copy of the third chromosome bearing the D2-3 insert; therefore, this third chromosome is also marked using Ki, so it may be selected against. The transposition event is frequently pre-meiotic and results in a cluster of identical exceptional sons. Typically dysgenic males are cultured singly with the yw female, and only one exceptional son from each cross is used for subsequent crosses in order to avoid wasting effort through analyzing identical inserts. Under these conditions, the transposition rate for comparison with other experiments is the fraction of dysgenic males that yield at least one exceptional son.
It is assumed often that the transposition for several elements will be additive, but tangible data is absent. Therefore we want to determine if the transposition of one element interferes or interacts with another in a multiple element genotype. In order to examine this question we compared transposition rates from the same fathers for two differently marked elements on the X chromosome. We also looked at the independence of w+ and y+ transposition as another measure of interactions in the process.
Source of Marked Transposable Elements
One element is the y+ marked UAS EP insert # 4, which was found to
transpose from X to A in about 50% of the dysgenic fathers in a previous study
(Crisp and Merriam, 1997, DIS 80: 90-92).
The second element is the w+ marked Gal 4 enhancer trap A9, based on
pGaw B and furnished by Ethan Bier.
It transposes at a lower rate with approximately 20% of the dysgenic
males yielding a w+ exception.
Experimental Design
Females (strain 4A9) homozygous for both elements on the X chromosome with a background genotype of yw were crossed to males having the third chromosome with the kinked marker (Ki) and D2-3 transposase. Their sons, the “dysgenic males,” were cultured individually with two to three yw females. Resulting progeny were scored for regular classes and for exceptional y+w sons and yw+ sons (Figure 1).
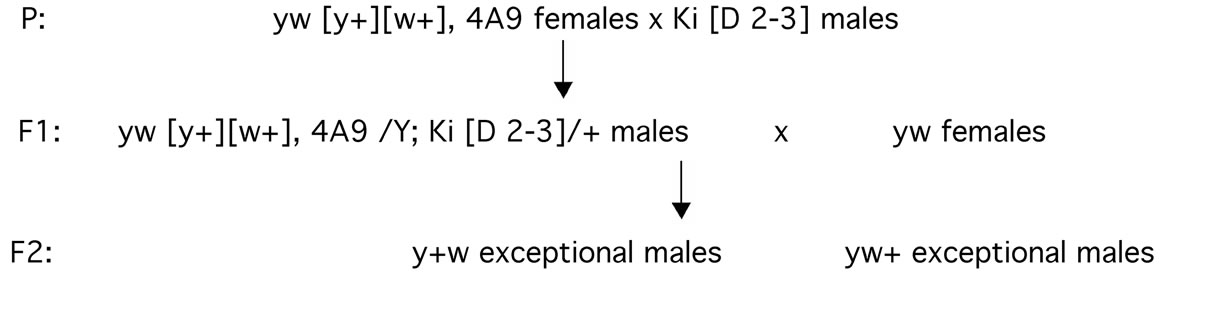
Figure 1. Experimental layout to generate two types of exceptional males.
Two series of identical crosses were made at different times. The results are comparable except for the difference that the second series only scored exceptions that were non-Kinked (half of the exceptions are Kinked and half are non-Kinked since the dysgenic father are heterozygous for the Kinked containing chromosome). In practice, screens to generate new transposition-locations routinely discard the exceptional males that also received the D2-3 chromosome from the dysgenic father (in order to have only stable transpositions). For this reason, the transposition frequency that is most relevant is the fraction of the fathers producing a non-Kinked (non D2-3) exceptional son(s). Because of clustering of exceptional sons, most dysgenic males that yield any exceptional sons will have at least one that is non-Kinked. Hence the transposition frequency measured this way for the second series is not much lower than the measure counting any exceptional male.
|
|
Results
Series
I
Out of 312 fertile crosses in series one, there was a higher frequency of fathers yielding y+w exceptional sons than those yielding yw+ exceptional sons, as expected (Figure 2). 178 dysgenic males, out of 312 crossed in series I yielded at least one y+w son and 59 yielded at least one yw+ son. Several y+w+ sons were found which turned out to be sterile. Their origin is attributed to nondisjunction and they are not discussed further.
Series
II
Out of 1669 fertile crosses in series two, there was again a higher frequency of y+w exceptions than yw+ exception (Figure 3). 728 dysgenic males yielded at least one y+w son, 343 dysgenic males yielded at least one yw+ son.
|
Figure 3. Numbers of dysgenic males that generated an exceptional son, by marker in series II.
|
Analysis of Results
What is observable from both series of crosses is that the frequency of transposition for either element appears to be unchanged by the presence of the other element. That is about 50% of the dysgenic fathers yield one or more y+ sons and about 20% of the dysgenic father yielded one or more w+ sons. The results are approximately additive in that the frequency of dysgenic males yielding a y+ son and w+ son is higher than 50%. Does this mean that transposition at either element is independent of the other? What determines if a dysgenic male will give at least some exceptional sons? If, for example, transposase or transposition is somewhat limited and not completely additive, then dysgenic males could appear to yield either y+ sons or w+ sons with fewer yielding both classes; this will appear as non independence of y+ and w+. Alternatively, if some males are physiologically better able to promote transposition, they should be more likely to yield both y+ sons and w+ sons. This also will appear as non-independence.
The percentages of dysgenic males defined by the kinds of exceptions they yield, a y+ only exception or a w+ only exception, or both y+ and w+ exceptions, or neither exception, are presented in Figure 4 and Table 1.
Table 1 compares the numbers of dysgenic males for each category with the numbers expected from independence of occurrence of y+ exceptions and w+ exceptions. The expected numbers are calculated from a two by two contingency table, with the y+ transposition positive and y+ transposition negative frequencies forming one axis and w+ transposition positive and w+ transposition negative frequencies forming the other axis.
|
Series I
Series II
Figure 4. Pie diagram of the proportion of dysgenic males yielding only y+ exception(s) (1), only w+ exception(s) (2), both y+ exceptions and w+ exceptions (3), or not yielding any exceptions, (4).
|
Although the expected numbers compared to counted data in contingency
tests may be evaluated by Chi-squared with one degree of freedom, the comparisons
made here are too variable to be to be appropriate for Chi-squared analysis. Instead, any significance stems from both
cross series giving similar results.
More of the dysgenic fathers yield both y+ exceptional sons and w+
exceptional sons than expected assuming independence. While the differences are not large, they support the notion
that there is an underlying area of variability between dysgenic males making
some more potent transposers, although perhaps not greatly so. The results suggest a degree of “hyperadditivity.”
To this extent, the strategy of combining multiple elements in the
same dysgenic male to take advantage of transposition opportunities seems
appropriate. An extension to this question would be
to measure a combination of P element transposition, hobo element transposition or mariner element transposition
in the same fly to ask if it is a property of the element or is a property
of the fly and its culture condition.
|
Table 1. Observed and calculated proportions of the dysgenic males classified according to their exceptional progeny.
|
A common use of generating transposed inserts at new locations in the genome is for enhancer trapping and EP studies. The y+ marked element is an EP type driver (Crisp and Merriam, 1997, DIS 80: 90-92), and the y+w exceptions from series I were further tested by crossing one exceptional male to two to three virgin females bearing the actin promoter Gal 4 drivers marked with w+ and balanced over CyO. In this test, the “experimental” progeny receiving both the w+ marked Gal 4 driver and the y+ marked UAS responder (to express the adjacent endogenous gene) are clearly distinct from their siblings. We found 28 of the 178 lines in series I were found to be completely lethal for the y+w+ experimental progeny. The importance of this figure is its implication that approximately one third of genes are capable of harming fly development when misexpressed. This subject will be addressed in another report.
|
Table 2. Progeny from y+ w fathers tested with
MB in series II. Various developmental defects ranging from bristle
deformities to lethality consistent for all y+ w+ progeny. MB is a balanced
stock containing M (3)66D and the novel gal 4 driver B11-98 (Merriam,
in preparation).
|
The y+ exceptions from series II were used in a screen for minute mutation suppressors, although none were found. A partial list of phenotypes observed in crosses to bristle Gal 4 drivers is included in Table 2.
Crosses with y+w exceptions were scored for abnormalities such as short/inhibited bristle growth, possible minute suppressors, semi or total lethality, and wing deformities. Occasionally flies had a very dark body color due possibly to an extra y+ marker, seen in HM 537, HM 776, and HM 853. Often the macrochaete was more affected than the microchaete, indicating that the larger bristles possibly have a lower tolerance and are more vulnerable for change than others. As for the other phenotypes obtained, it was interesting to note that HM 165 was able to have one bristle on a specific locale on the fly body. Also another line (HM 421) had bristles that were all present but did not grow beyond the thorax shell. This reinforces the idea that larger or longer bristles are more vulnerable for change. Rarely it was observed during scoring that the gray flies had yellow wings and yellow bristles while still retaining the gray body color. This rare event was attributed to the position effect seen in HM160.
Similarly, crosses with w+ exceptions from both series were scored for minute suppression that restore normal bristles size. A similar screen was used to select the B11-98 gal 4 driver (Merriam, in preparation). Each w+ exception was tested for Gal 4 production in bristles by means of crosses to flies with a minute mutation (66D) together with the UAS and cDNA of its gene product (rpL14). Eight additional lines marked with w+ exhibited suppression for the minute phenotype by restoring the bristle to normal size and a darker color. They will be described in another report.
The goal in this experiment was to determine if the presence of one or more P inserts influences the transposition rate of either insert and how it influences the rate. From our data as well, it can be concluded that the presence of an insert can be powerful in inducing phenotypes.
 Figure 2.