|
Satellite Image Processing Strategies Environmental planning and the field of remote sensing has been advanced by the ability to determine the physical properties of various earth components from great distances. Satellite technology provides information about the environment on a planetary scale. Satellites, orbiting the earth at a distance of hundreds of miles, gather physical, biological, and social/cultural characteristics and transmit representations (Images) to earth. These images accurately depict the spatial relationships of the complex earths surface. These earth images are valuable in determining the accurate past or current land activity for direct GIS application. There are thousands of satellites orbiting the earth. Since the late 1950's these electronic marvels have been a source of amazement to even the casual observer. Although few individuals have an understanding of the complex satellite technology we generally share a perception of national pride in the technical accomplishment. Our lives have been transformed forever by these orbiting communication and information platforms. Originally imaging satellites were created for military purposes. Oil, gas and mineral exploration soon followed the military lead. The advent of a stable earth observation platform soon interested all nations interested in planning and designing on a regional basis.
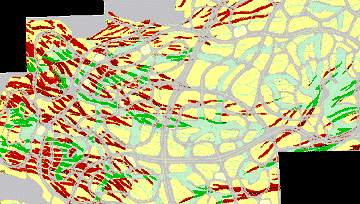
Change Detection Strategies and Quantifying Human Activities The necessity to determine change begins with a realization that the earths surface changes over time through natural phenomenon and human activity. Surface changes are compared in a "before and after" format determined by the needs of the GIS user. Change detection involves comparing two satellite images (or air photos) of the same location, using two separate dates. Obviously, the difference in the dates will depend on the purpose of the study. Usually, the time difference is measured in years rather than days. For example, the dates must be of sufficient time difference for the subject and area of interest to be discernible. Seasonal differences such as fall-spring or summer-winter are valuable change detection strategies investigating elements such as seasonal water (high/low) or vegetative composition (leaf on/off). Obviously, some situations cannot be resolved using the "change over time" strategy due to unexpected data circumstances such as: 1) Situations where information is unavailable. For example, there is only one set of air photos (or satellite images) available.The need the range, extent, or magnitude of land surface modification, by the change detection can also be accomplished by using accurate paper maps and air photos or satellite images. Often there are accurate paper maps created by private companies or government agencies. When converted to a digital format a comparative analysis can be made among and between paper maps, air photos and satellite images.
Return to EARTHUSE Homepage All contents copyright (C) 1992-1999, D. Fehler and R. Robinson, All rights reserved. |
||||