Quantitative Analysis
Analytical Methods and Software
Quantitative analysis can be performed by wavelength-dispersive spectrometry, energy-dispersive analysis, or a combination of both. Most quantitative work is performed via the WDS. The software package controlling microprobe automation is the Probe for EMPA, which was developed by John Donovan. This is an extremely versatile group of programs supporting both individual point (manual mode) analysis or automated analysis of stored point locations for unattended operation. Among many features, this package supports: (a) full asynchronous control of all five WDS; (b) x-ray intensity acquisition modes including simple intensity above mean background and integration of x-ray band areas; (c) background acquisition methods including 2 point, 1 point & slope, or none, with linear or curved background shape models; (d) the use of multiple beam conditions (up to one for each different element); (e) automatic or user-selected order of analysis on each spectrometer; and (f) analysis of up to 40 elements. To this basic package, the Probe for EPMA by John Donovan package provides complete integration of EDXA automation with standard WDS microprobe function and matrix correction procedures.
Elements of interest are usually treated as analytical unknowns, but elements present and not analyzed for can be determined by stoichiometry or difference. If known, the concentrations of any given element(s) can be entered manually, to permit inclusion in the matrix correction calculations. Data reduction methods include PAP and XPP (modified f (r z)) methods, and a ZAF algorithm. Mass absorption coefficients from Heinrich (1986), except for those of the light elements which are from Pouchou and Bastin. Element valences and compound formula stoichiometry can be changed on a point-by-point basis during manual analysis, or after automated analysis can be changed and the results recalculated for all or selected groups of points off-line. For geologists, the software permits the assignment of mineral groups for any chosen point or group(s) of points during manual or automated analysis, permitting analysis and formula calculations (both cations and end-member abundance for many solid solutions) for many different mineral groups with a single analytical file.
Why Use Wavelength Dispersive Spectrometry (WDS)?
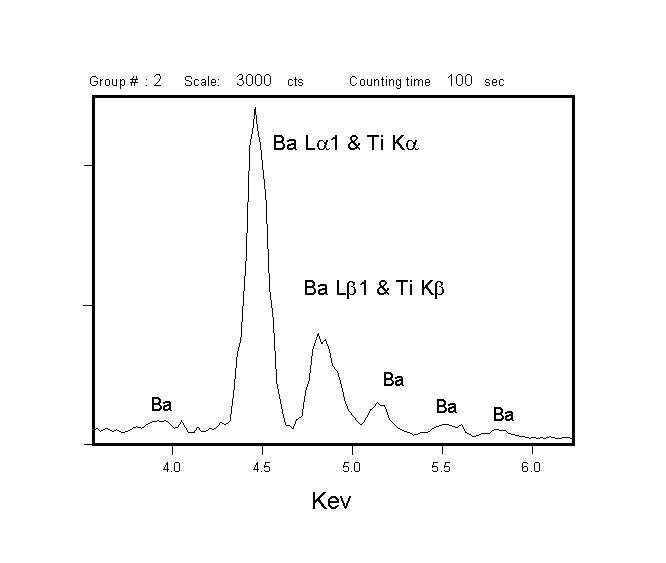
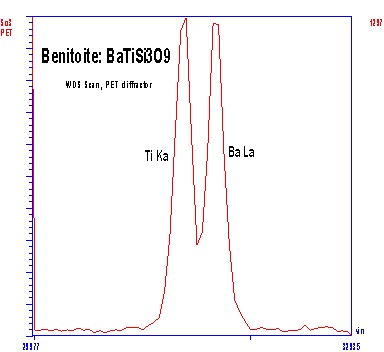
Both WDS and EDXA (Energy Dispersive X-ray Analysis) can be used to detect x-rays for analysis, but WDS has superior resolving power for x-ray lines, and yields larger signal/noise ratios. The superior resolution of WDS is demonstrated by comparing EDXA and WDS spectra acquired from benitoite (BaTiSi3O9) in the region of Ba and Ti x-ray emission. The Ti Ka and Ba La 1 peaks show complete overlap by EDXA (left), but are well resolved by WDS (right). Thus, the superior resolution of the WDS makes analysis of element pairs with overlapping emission lines (e.g., Ti & Ba or Ti & V) much more accurate, and larger signal/noise ratios improve minimum levels of detection for minor and trace elements.


Analytical Capabilities
Available diffraction devices in our five WDS permit analysis of elements with Z >= 5 (boron), producing common minimum detection limits (MDL) in the 100-200 ppmrange (elemental basis) using counting times of 30-60 seconds on peak.
Some of the analytical capabilities of the system are demonstrated by the analytical result below from the analysis of a tourmaline group mineral [(Na,Ca)0-1(Fe,Mg,Mn,Al,Li)3Al6(BO3)3Si6O18(O,OH,F)4]. By constraining all of the elements with Z >= 5 in a material, light element components (such as Li, Be, or, in the case below, H2O in the formula) can be deduced with reasonable accuracy by the difference of analytical totals from 100%.
Point | 15: | ( -13186,-23943, -54), | 3 iterations------------BRTUR1-5 | ||||||
|---|---|---|---|---|---|---|---|---|---|
Element | Wt% | At% | Ix/Istd | Kratio | Z.A.F. coefficients | Ox% | Cat# | ||
B | 3.06 | 5.59 | 0.8501 | 0.0026 | 0.9304 | 13.9802 | 1.0000 | 9.84 | 2.77 |
O | 47.68 | 58.81 |
|
|
|
|
| 0.00 | 0.00 |
F | 0.91 | 0.95 | 0.0869 | 0.0021 | 1.0266 | 4.2989 | 1.0001 | 0.91 | 0.47 |
Na | 0.70 | 0.60 | 0.0780 | 0.0029 | 1.0506 | 2.3362 | 0.9991 | 0.95 | 0.30 |
Mg | 8.75 | 7.10 | 0.2968 | 0.0600 | 1.0336 | 1.4201 | 0.9960 | 14.52 | 3.54 |
Al | 15.23 | 11.14 | 0.7453 | 0.0907 | 1.0687 | 1.5792 | 1.0028 | 28.77 | 5.54 |
Si | 17.36 | 12.20 | 0.4892 | 0.1781 | 1.0427 | 1.0601 | 0.9997 | 37.13 | 6.06 |
K | 0.01 | 0.01 | 0.0008 | 0.0001 | 1.1135 | 1.0998 | 0.9948 | 0.01 | 0.00 |
Ca | 2.83 | 1.39 | 0.2256 | 0.0248 | 1.1034 | 1.0343 | 0.9993 | 3.96 | 0.69 |
Ti | 0.51 | 2.10 | 0.0207 | 0.0041 | 1.2187 | 1.0151 | 0.9996 | 0.85 | 0.10 |
Mn | 0.02 | 0.01 | 0.0007 | 0.0002 | 1.2627 | 1.0000 | 1.0030 | 0.03 | 0.00 |
Fe | 0.29 | 0.10 | 0.0120 | 0.0024 | 1.2460 | 0.9976 | 1.0003 | 0.38 | 0.05 |
Sum | 97.35 | 100.00 |
|
|
|
|
| 97.35 | 19.52 |
Standard Materials
Our inventory of standards includes over 300 well-characterized reference materials, for intensity calibrations on most of the elements from B (z = 5) to U (z = 92). These include a large suite of natural and synthetic minerals (silicates, oxides, carbonates, sulfides, phosphates, halides), natural and synthetic glasses, pure elements (metals), element oxides, and metal alloys.
Limits of Detection, Accuracy, and Analysis Time
For most elements with z > 9, minimum detection limits (MDL, at 3-s above mean background) down to 50 ppm on an elemental basis are common, and can be lowered by almost an order of magnitude for many trace components. The MDL are commonly higher for the ultralight elements, with values of 500-1000 ppm common for B (z = 5). Analytical accuracy for major and minor components, determined from counting statistics, is often as low as 0.1% relative to the element concentration. Inverse relationships between analysis time and MDL or accuracy should be noted, such that decreased MDL and increased accuracy are accomplished by the use of longer counting times. Consider that for most elements analyzed using Ka x-ray lines, elemental MDL in the 50-100 ppm range require on the order of 30-60 seconds counting on peak (and an equal time on background). Thus, an analytical routine comprised of 15 elements can commonly be achieved in 3-5 minutes with MDL in this range.
Interference Corrections
Even with the resolving power of the WDS, there still are cases where x-ray line overlap cannot be avoided. To alleviate these uncommon problems, the Probe for EMPA analytical software contains methods for correcting interferences based upon calibration from standard materials.
Interference among first order x-ray lines is more common between pairs of elements with moderate to heavy atomic numbers (Z ³ 12) such as Ti & V or Ti & Ba. The following example shows how the overlap of Ti Kb on V Ka leads to a false V2O5 content of 1.92 wt.% in the analysis of titanite (CaTiSiO5). Correction for this interference removes the fictive V as well as improving the results of other major components by providing correct intensities used in the matrix calculations.
| Oxide | Without Correction | With Correction | Standard Value |
|---|---|---|---|
| SiO2 | 30.65 | 30.65 | 30.65 |
| CaO | 30.56 | 28.65 | 28.6 |
| TiO2 | 40.85 | 40.62 | 40.75 |
| V2O5 | 1.92 | 0 | 0 |
| Total | 103.98 | 99.92 | 100 |
Interference among higher order x-ray lines is especially important for analyzing light elements. Shown below is the effect of correction for third order P Ka on F Ka in an REE-bearing apatite, Ca5(PO4)3(OH,F), which is both a non-biologic mineral and the principal hard component of vertebrate teeth and bone. Lack of correction results in fictive F contents that are greater than the possible stoichiometric occupancy of F in the mineral formula (which is about 3.73 wt.% F).
| Oxide/anion | Without Correction | With Correction | Standard Value |
|---|---|---|---|
| CaO | 54.19 | 54.14 | 54.02 |
| P2O5 | 40.82 | 40.86 | 40.88 |
| F | 5.29 | 3.68 | 3.53 |
| O=F | -2.23 | -1.55 | -1.48 |
| Total | 98.07 | 97.13 | 96.95 |
Data Manipulation and Output
The Probe for EMPA automation system provides for very flexible treatment of analytical data. From any stored analytical file, the user can select any or all information (raw x-ray intensities, intensities relative to standards, K-ratios, element concentrations, oxide concentrations, atomic proportions, cations, etc.) for output either to hardcopy or text file (pre-formatted for Microsoft Excel). Moreover, the system permits the importation of a new standard (including insertion of a new element and intensity acquisition for points already analyzed), change of valence or formula stoichiometry, and off-line recalculation of analytical results for all or selected points within the file. Additional subroutines exist for sorting the data, in which selected points can be grouped and averaged with user-selectable levels of confidence (sigma) for statistics; the sorted groups of points can be output to hardcopy, Excel-compatible text file, or a new Probe for EMPA analytical file.

