Experiment Summary and Publications
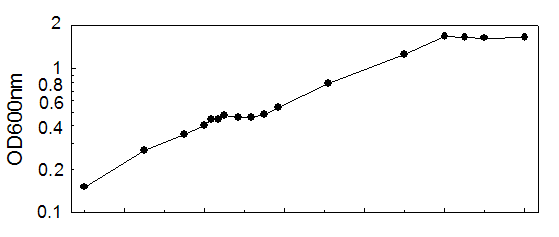
Time (min) A600
Timepoint
90.0000 0.1500 logD1
135.0000 0.2700 logD2
165.0000 0.3500 logD3
180.0000 0.4020 logD4
185.0000 0.4400 logD5
190.0000 0.4400 logD
195.0000 0.4720 logD7
205.0000 0.4560 logD8
215.0000 0.4560 logD9
225.0000 0.4800 logD10
235.0000 0.5400 logD11
273.0000 0.7920 logD12
345.0000 1.4080 logD13
360.0000 1.6800 logD14
375.0000 1.6480 logD15
390.0000 1.6400 logD16
420.0000 1.6480 logD17
Experimental Design
Culture conditions. E. coli MG1655 (CGSC #6300) was cultured in 1 liter of morpholinepropanesulfonic acid (MOPS) minimal medium containing 0.5 g/liter of glucose and 1.5 g/liter of lactose (Neidhardt et al., 1974) in a 2 liter Biostat B fermentor. The temperature was maintained at 37 degrees C and pH was kept constant at 7.2 by the addition of 2 M NaOH. The dissolved oxygen level was maintained above 20% of its saturation level by adjusting the agitation speeds in the range of 400-600 rpm with fixed 1 liter/min air flow rate. Growth was monitored by measuring the optical density (OD) at 600nm. These growth conditions resulted in a diauxic lag lasting 36 min.. The culture continued growing until entering stationary phase upon exhaustion of carbon and nitrogen. RNA samples were isolated at 5 and 10 min intervals following the diauxic lag, and at appropriate intervals during the experiment, by pipeting into ice-cold RNAlater™ (Ambion, Austin, TX) followed by purification using an RNeasy™ Mini Kit (Qiagen, Valencia, CA). The RNA samples were labeled by first strand cDNA synthesis. Labeled targets were hybridized to DNA arrays (Panorama E. coli Gene Arrays, Sigma Genosys Biotechnologies, Inc., The Woodlands, TX). The hybridized arrays were scanned by phosphorimaging at a pixel density of 100 microns (10,000 dots/cm2) with a STORM 820 PhosphoImager (Molecular Dynamics, Sunnyvale, CA) following exposure to a Kodak Storage Phosphor Screen GP (Eastman Kodak Co., Rochester, NY) for 24 hrs. The array membranes were consecutively hybridized, stripped, and rehybridized.Spot-finding and quantitation. Image analysis software (ArrayVision, Imaging Research, Inc.) was used for spot-finding and quantitation of the E. coli Panorama arrays. The raw spot intensities were represented in a row-column format and exported into Microsoft Excel spreadsheets for further analysis, or as comma-delimited files (.csv) for upload to the database. Raw data from each experimental replicate were analyzed in Excel workbooks containing manually executed macros written in Visual Basic, or the data were processed in the database. The first step in the analysis associates the array coordinate for each spot with a unique spot number, the gene name, and related gene annotation. On the membrane arrays there are two spots for each gene, and these were treated as separate determinations. The raw data were normalized by expressing spot intensities as a percentage of the sum of all of the gene-specific spot intensities. The second step in the analysis applies the student t-test to determine the probability that the average of the experimental replicates is significantly different from the average of the control replicates . The P values (derived from the student t-test) for the normalized and natural log transformed data were calculated. The third step calculates relative gene expression between conditions by introducing a threshold value, chosen to be representative of the limit of detection of expressed genes (usually the 500th lowest expressed gene), and then calculating the ratio of the experimental/control expression levels such that genes that are more highly expressed in the experimental condition are given a positive value, and genes that are more highly expressed in the control condition are given a negative value.
Control for ratio calculation. The early log phase control values used for the diauxie experiment represent the average of 12 hybridizations: two each from time points 1 and 2 of the H2O2-treatment and time points 1 and 3 of the glucose-lactose diauxie and 4 from time point 2 of the glucose-lactose diauxie. This approach is possible because gene expression is essentially steady-state in early-logarithmic phase and because there is excellent correlation between these time points. The use of these control values allowed us to directly compare the H2O2-treatment and glucose-lactose diauxie.
Data Legend
Diauxic Growth Data Set (Excel: 4.8
Mb)
logD1/Cont: Log10 ratio of timepoint 1 vs. multi-timepoint control
PLND1/cont: P value for the corresponding log ratio calculated from
the normalized, natural log transformed data
D 1AvgPct: average normalized spot intensity values expressed as
a percentage of the sum of all of the gene-specific spot intensities
Array Coordinate: location of spot on array
Gene: gene name
b#: unique identifier for gene
E. coli Gene Expresssion
Database (Oracle) Interface
Raw Data File Available on
request (8 raw data columns for each timepoint)
Time point: 1
17
Replicate: a, b (2 replicate arrays for each timepoint)
Volume: VolA, VolB (raw intensitie values; duplicate spots for each
gene on each array; total of 4 measurements)
Normalized Vol: PctA, PctB (each spot intensity expressed as percentage
of sum of all spot intensities on array)
TST_diauxic_1a_VOLA: timepoint 1, replicate hybridization a; raw
data for duplicate spot A
TST_diauxic_1a_VOLB: timepoint 1, replicate hybridization a; raw
data for duplicate spot B
TST_diauxic_1a_PCTA: normalized value for 1a_VolA
TST_diauxic_1a_PCTB: normalized value for 1a_VolB
TST_diauxic_1b_VOLA: timepoint 1, replicate hybridization b; raw
data for duplicate spot A
TST_diauxic_1b_VOLB: timepoint 1, replicate hybridization b; raw
data for duplicate spot B
TST_diauxic_1b_PCTA: normalized value for 1b_VolA
TST_diauxic_1b_PCTB: normalized value for 1b_VolB