 |

|
July, 2002 Data Sets Diauxic Growth Experimental Design and Data H2O2
Treatment Experimental Design and Data Project summary.
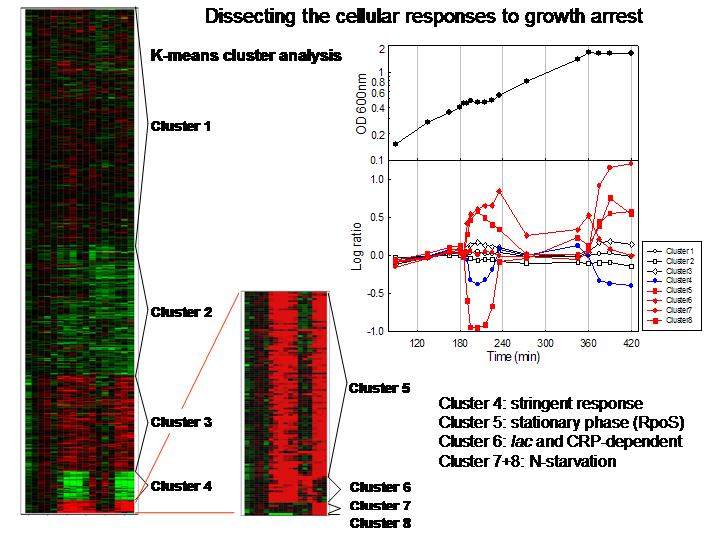
When conditions cause bacterial growth to stop, extensive reprogramming
of physiology and gene expression allows for the cells survival. We
used whole-genome DNA arrays to determine the system response in E.
coli cells experiencing transient growth arrest caused by glucose-lactose
diauxie and H2O2-treatment,
and also entry into stationary phase. The results show that growth arrested
cells induce stringent control of several gene systems. The vast majority
of genes encoding the transcription and translation apparatus immediately
down-regulate, followed by a global return to steady-state when growth
resumes. Approximately one-half of the amino acid biosynthesis genes down-regulate
during growth arrest, with the notable exception of the
his operon which transiently up-regulates
in the diauxie experiment. Nucleotide biosynthesis down-regulates,
a result that is again consistent with the stringent response. Likewise,
aerobic metabolism down-regulates during growth arrest, and the results
led us to suggest a model for stringent control of the ArcA
regulon. The stationary phase stress response
fully induces during growth arrest, whether transient or permanent, in
a manner consistent with known mechanisms related to stringent control.
Cells similarly induce the addiction module antitoxin and toxin genes
during growth arrest; the latter are known to inhibit translation and
DNA replication. The results indicate that, in all aspects of the response,
cells do not distinguish between transient and potentially permanent growth
arrest (stationary phase). We introduce an expanded model for the stringent
response that integrates induction of stationary phase survival genes
and inhibition of transcription, translation, and DNA replication. Central
to the model is the reprogramming of transcription by ppGpp,
which provides for the cells rapid response to growth arrest and, by
virtue of its brief half-life, the ability to quickly resume growth as
changing conditions allow. Time (min)
A600 Timepoint Spot-finding and quantitation. Image analysis software (ArrayVision, Imaging Research, Inc.) was used for spot-finding and quantitation of the E. coli Panorama arrays. The raw spot intensities were represented in a row-column format and exported into Microsoft Excel spreadsheets for further analysis, or as comma-delimited files (.csv) for upload to the database. Raw data from each experimental replicate were analyzed in Excel workbooks containing manually executed macros written in Visual Basic, or the data were processed in the database. The first step in the analysis associates the array coordinate for each spot with a unique spot number, the gene name, and related gene annotation. On the membrane arrays there are two spots for each gene, and these were treated as separate determinations. The raw data were normalized by expressing spot intensities as a percentage of the sum of all of the gene-specific spot intensities. The second step in the analysis applies the student t-test to determine the probability that the average of the experimental replicates is significantly different from the average of the control replicates . The P values (derived from the student t-test) for the normalized and natural log transformed data were calculated. The third step calculates relative gene expression between conditions by introducing a threshold value, chosen to be representative of the limit of detection of expressed genes (usually the 500th lowest expressed gene), and then calculating the ratio of the experimental/control expression levels such that genes that are more highly expressed in the experimental condition are given a positive value, and genes that are more highly expressed in the control condition are given a negative value. Control for ratio calculation. The early log phase control values used for the diauxie experiment represent the average of 12 hybridizations: two each from time points 1 and 2 of the H2O2-treatment and time points 1 and 3 of the glucose-lactose diauxie and 4 from time point 2 of the glucose-lactose diauxie. This approach is possible because gene expression is essentially steady-state in early-logarithmic phase and because there is excellent correlation between these time points. The use of these control values allowed us to directly compare the H2O2-treatment and glucose-lactose diauxie. E. coli Gene Expression Database (Oracle) Interface H2O2 Treatment Experimental Design 100.0000 0.2480 logH1 140.0000 0.3840 logH2 145.0000 0.3760 logH3 150.0000 0.3800 logH4 160.0000 0.3960 logH5 170.0000 0.4080 logH6 180.0000 0.4160 logH7 200.0000 0.5040 logH8 255.0000 0.9000 logH9 330.0000 1.7800 logH10 345.0000 1.7840 logH11 390.0000 1.7840 logH12 Culture conditions. E. coli MG1655 (CGSC #6300) was cultured in 1 liter of morpholinepropanesulfonic acid (MOPS) minimal medium containing 2 g/liter of glucose (Neidhardt et al., 1974) in a 2 liter Biostat B fermentor. The temperature was maintained at 37 degrees C and pH was kept constant at 7.2 by the addition of 2 M NaOH. The dissolved oxygen level was maintained above 20% of its saturation level by adjusting the agitation speeds in the range of 400-600 rpm with fixed 1 liter/min air flow rate. Growth was monitored by measuring the optical density (OD) at 600nm. Immediately following timepoint 2 (H2), a sublethal concentration of H2O2 (50 ug/ml) was added to cause an immediate inhibition of growth, followed by a 40 min lag prior to resuming growth. The culture continued growing until entering stationary phase upon exhaustion of carbon and nitrogen. E. coli Gene Expression Database (Oracle) Interface Aerobic and Anaerobic Growth Experimental Design
Experimental DesignCulture conditions. E. coli MG1655 (CGSC #6300) was cultured in 1 liter of morpholinepropanesulfonic acid (MOPS) minimal medium containing 2.0 g/liter of glucose (Neidhardt et al., 1974) in a 2 liter Biostat B fermentor. The temperature was maintained at 37 degrees C and pH was kept constant at 7.2 by the addition of 2 M NaOH. For the aerobic culture, the dissolved oxygen level was maintained above 20% of its saturation level by adjusting the agitation speeds in the range of 400-600 rpm with fixed 1 liter/min air flow rate. For the anaerobic culture, the medium contained 35 mM Na H2CO3 and was sparged with a mixture of nitrogen and carbon dioxide gases (90:10) at a fixed 1 liter/min flow rate. Growth was monitored by measuring the optical density (OD) at 600nm.
Data Legend Aerobic
Growth Data Set (Timepoint 2 control; Excel: 3.1 Mb) Aerobic
Growth Data Set (Timepoint 1-4 averaged control; Excel: 3.4 Mb) AGTC_2_conpct: average normalized spot intensity for control timepoint 2; values expressed as a percentage of the sum of all of the gene-specific spot intensities AGTC_10_tstpct: average normalized spot intensity for test timepoint 10 AGTC_10_V_2_logratio: log10 ratio of timepoint 10 vs. timepoint 2 AGTC_10_V_2_pln: P value for the corresponding log ratio calculated from the normalized, natural log transformed data Anaerobic
Growth Data Set (Timepoint 1-4 averaged control; Excel: 3.4 Mb) Aerobic
vs. Anaerobic Comparison (Timepoints 1-6 averaged Excel: 1.5Mb) E. coli Gene Expression Database (Oracle) Interface |

 |
 |
|
Copyright © 2009 The Board of Regents of the University of Oklahoma | Disclaimer OU Bioinformatics Core Facility @ Advanced Center for Genome Technology | Credits | updated:19 Oct 2005 |