Carbon Nutrition of
E. coli in the Mouse Intestine
Chang,
et al., 2004, Proc. Nat. Acad. Sci. 101: 7427-7432 (.pdf)
This page provides
access to DNA array and mouse colonization supplemental data.
 Mucus Array
experiment design
Mucus Array
experiment design
Mouse Colonization
experiment design
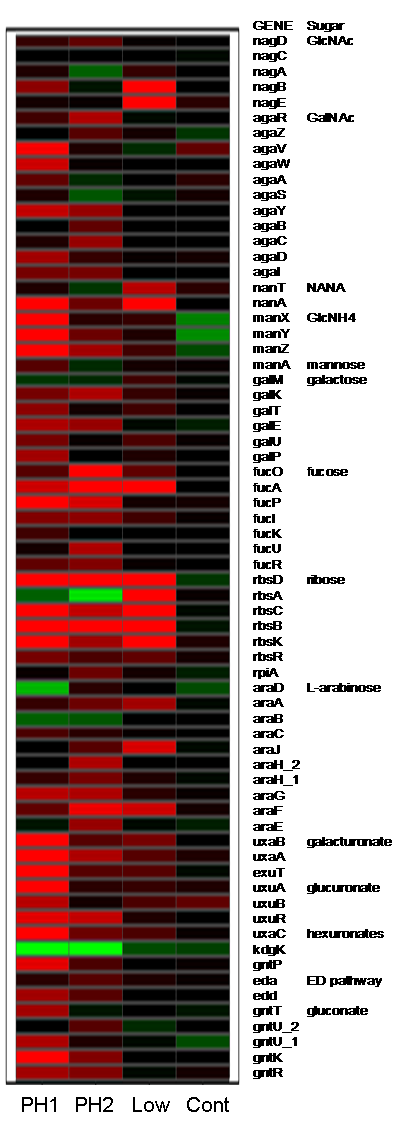
Project summary. Whole-genome expression profiling revealed
E. coli MG1655 genes induced by growth on mucus, conditions designed
to mimic nutrient availability in the mammalian intestine. Most were nutritional
genes corresponding to catabolic pathways for nutrients found in mucus.
We knocked out several pathways and tested the mutants in competition
with their wildtype parent for their relative fitness for colonization
of the mouse intestine. We found that only mutations in sugar pathways
affected colonization, not phospholipid and amino acid catabolism, not
gluconeogenesis, not the tricarboxylic acid cycle, and not the pentose
phosphate pathway. Gluconate appeared to be a major carbon source used
by E. coli MG1655 to colonize, impacting both the initiation
and maintenance stages. N-acetylglucosamine and N-acetylneuraminic acid
appeared to be involved in initiation, but not maintenance. Glucuronate,
mannose, fucose, and ribose appeared to be involved in maintenance, but
not initiation. The in vitro order of preference for these seven sugars
paralleled the relative impact of the corresponding metabolic lesions
on colonization: gluconate > N-acetylglucosamine > N-acetylneuraminic
acid = glucuronate > mannose > fucose > ribose. The results of this systematic
analysis of nutrients used by E. coli MG1655 to colonize the
mouse intestine are intriguing in light of the nutrient-niche hypothesis,
which states that the ecological niches within the intestine are defined
by nutrient availability. Since humans are presumably colonized with different
commensal strains, differences in nutrient availability may provide an
open niche for infecting E. coli pathogens in some individuals
and a barrier to infection in others.
Mucus
array experiments
MG1655_MG_MM_PH1 minimal glucose
vs. 10 mg/ml minimal mucus: phase 1
MG1655_MG_MM_PH2 minimal glucose vs. 10 mg/ml minimal mucus: phase 2
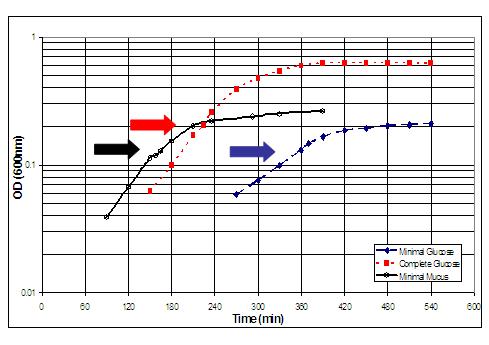
MG1655_MG_V_MM minimal glucose vs. 5 mg/ml minimal mucus
MG1655_MG_V_CG minimal glucose vs. glucose complete (supplemented)
MG1655_MG_V_CM minimal glucose vs. mucus complete (supplemented)
E.
coli Gene Expresssion Database (Oracle) Interface
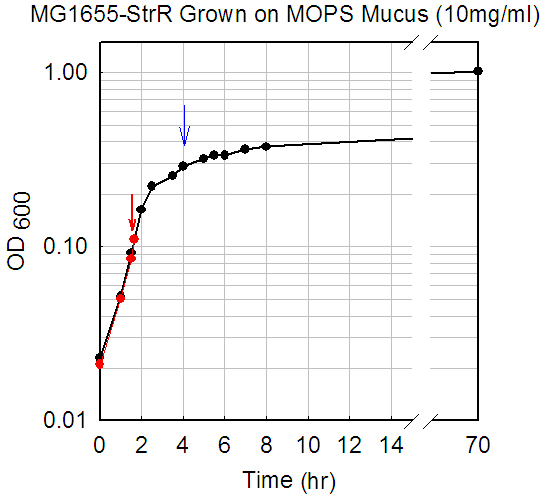
Rationale and culture
conditions. Since E. coli is known to grow rapidly in
vivo within the mucus layer of the intestine, presumably using nutrients
derived from the mucus, we grew E. coli in vitro in minimal salts
medium containing lyophilized mucus as the sole source of carbon and energy.
E. coli MG1655 was grown in triplicate at 37 degrees C, without
shaking, in 18 mm test tubes containing 5 ml of the MOPS-based culture
medium designed by Neidhardt for proteome studies. Mouse cecal mucus was
prepared from streptomycin-treated CD-1 mice (not colonized with E.
coli). Cultures were grown in triplicate to early (A600 = 0.1) or
late (A600 = 0.3) logarithmic phase in 5 or 10 mg/ml of lyophilized mucus.
Duplicate or quaduplicate arrays were obtained for each condition. For
further information regarding culture conditions and preparation of mucus,
please refer to Moller,
et al.
MG1655-StrR grown on mucus (5 mg/ml)
Mouse Colonization Assays (Go
to all public datasets)
Gluconate
(edd)
N-acetylglucosamine(nagE
manXYZ)
N-acetylneuraminic
(sialic) acid (nanAT)
Glucuronate
(uxaC)
Mannose
(manA)
Fucose
(fucK and fucAO)
Ribose
(rbsK)
Galacturonate
(uxaB)
Ethanolamine
(eutBC)
Glycerol-3-phosphate
from phospholipids (glpTQ)
Glycerol
(glpK)
Fructuronate
(gntP)
B-glucuronides
(uidA)
Tryptophan
(tnaA)
Glycolysis
(pgi phosphoglucose isomerase)
Pentose
phosphate pathway (gnd 6-phosphogluconate dehydrogenase)
TCA cycle
(sdhB succinate dehydrogenase)
Gluconeogenesis
(ppsA pckA phosphoenolpyruvate synthase and phosphoenolpyruvate
carboxykinase)
The
Streptomycin-treated Mouse Model of Intestinal Colonization
Overview: The streptomycin-treated mouse is the model
of choice for determining the relative fitness of enteric bacteria for
intestinal colonization, which can be subdivided in two distinct stages,
initiation and maintenance (Miranda, et al., 2004; Moeller, et. al.,
2003). During initiation (5 h to three days post-feeding), small numbers
of E. coli grow rapidly to high numbers. A few days following
initiation, the growth rate and slough rate become balanced to achieve
a stable population in the maintenance stage (day 7 post-feeding and
beyond). Streptomycin treatment preferentially eliminates the facultative
flora and leaves the anaerobic flora largely intact. Like the conventional
mouse, the streptomycin-treated mouse large intestine contains a myriad
of species, each competing for available nutrients. It is therefore
likely that the rapid growth of E. coli in the intestine during
the initiation stage depends on utilization of non-limiting nutrients
made available by removing the streptomycin-sensitive facultative microflora,
i.e., nutrients which the anaerobic flora apparently do not utilize.
Rationale: The
way to find out what an individual strain chooses to grow on in the
intestine - in the absence of competition from other E. coli
strains -- is to simultaneously feed the wildtype parent with an isogenic
mutant which is blocked in a specific metabolic pathway. If that pathway
and the corresponding nutrient are important, then the mutant will be
less fit to compete with the wildtype. Mutant strains that do not compete
effectively for nutrients involved in initiation will fail to reach
the same high numbers as the wildtype. Since rapid growth during initiation
occurs when nutrients are not limiting, these experiments reveal the
in vivo nutrient preference. Mutants which do not compete effectively
for nutrients involved in maintenance (whether or not they initiate
efficiently) will decline in numbers relative to the wildtype during
the maintenance stage. The streptomycin-treated mouse colonization assay
provides a relative measure of fitness - the nutrients involved and
whether the nutrient has a major, significant, or minor role. These
experiments are attractive in that even a negative result - a mutation
that has no effect on fitness for colonization - is useful.
Experimental approach:
Streptomycin-treated mouse colonization assays can be designed
in several different ways to determine the relative fitness of two or
more strains for colonization. The method used to compare the large
intestine colonizing abilities of E. coli strains in mice has been described
previously (Sweeney, et al., 1996). Briefly, three male CD-1 mice (5-8
weeks old, from Jackson Laboratories) are given drinking water containing
streptomycin sulfate (5 g/liter) for 24 h to eliminate resident facultative
bacteria (Hentges, et al., 1984; Miller and Bonhoff, 1963). Following
18 h of starvation for food and water, the mice are fed 1 ml of 20%
(w/v) sucrose containing Luria broth-grown E. coli strains,
depending on the experiment. After ingesting the bacterial suspension,
both the food (Charles River Valley Rat, Mouse, and Hamster Formula)
and streptomycin-water were returned to the mice, and 1 gram of feces
is collected after 5 h, 24 h, and on odd numbered days at the indicated
times. Mice are housed individually in cages without bedding and placed
in clean cages daily. Fecal samples (no older than 24 h) are homogenized
in 1% Bacto Tryptone, diluted in the same medium, and plated on Luria
agar plates with appropriate antibiotics. Plates contain streptomycin
sulfate (100 µg/ml), streptomycin sulfate (100 µg/ml) and
nalidixic acid (50 µg/ml), or streptomycin sulfate (100 µg/ml)
and chloramphenicol (30 µg/ml). All plates are incubated for 18
to 24 h at 37*C prior to counting. The NalR and other antibiotic resistance
markers have no effect on colonization in control experiments.
Nutrients used for
initiation: (simultaneous low feeding experiments) Three mice
are fed 100,000 cfu each of two E. coli strains. The strains
are counted in feces at 5 hours, 1 day, and at 2 day intervals post-feeding.
A mutant strain that is defective in its ability to initiate colonization
will reach lower numbers, relative to the wildtype parent, within 3
days post-feeding, whereas the wildtype normally grows from 100 thousand
to about 10 million cfu per gram of feces within 1 day post-feeding.
A strain that has no trouble initiating colonization but is defective
in the maintenance stage will grow to the same high level as the wildtype
strain for 1-3 days and then will decline in numbers relative to the
wildtype. This experiment is designed to reveal the relative contribution
of nutrients that are involved in the initiation and/or maintenance
stages of colonization in competition with the wildtype parent.
Nutrients used for
maintenance: (pre-colonization experiments) The simultaneous
low feeding experiment does not always provide an accurate measure of
the impact of a particular mutation on maintenance; the following experiment
does. Three mice are fed 100 thousand CFU of the E. coli wildtype
and allowed to reach the maintenance stage (10 days after feeding);
then the mice are held overnight without food and water and the next
morning fed 10 billion cfu of the mutant strain. In a control experiment,
mice are challenged with a differentially marked wildtype strain, which
would be expected to colonize. Post-feeding, feces are collected from
each mouse, and counted as described above, at 5 hours, 1 day, and 2
day intervals for 15 days. If the mutant strain has no trouble in maintenance,
it will remain in the intestine and co-colonize with the wildtype parent
in high numbers. If the mutant strain has difficulty in maintaining
colonization, it will decline in numbers, relative to the wildtype parent,
to the degree that the nutrient in question affects maintenance.
Feeding alone:
Mutants with a severe defect in initiation, maintenance, or both are
tested to see if they are able to colonize in the absence of competition
with the wildtype parent, i.e., when fed alone. Three mice are fed 100
thousand CFU of the E. coli mutant and the strain counted in
feces at 5 hours post-feeding, 1 day post-feeding, and at 2 day intervals
thereafter. Strains that cannot colonize will be lost from feces. This
experiment implicates a nutrient as being important, but indicates that
an alternative strategy may be required (i.e., mutation of a different
step in the pathway to be sure that toxic metabolites are not involved).
References
Chang, D.E.,
D. Smalley, D. L. Tucker, M. P. Leatham, W. E. Norris, S. J. Stevenson,
A. B. Anderson, J. E. Grissom, D. C. Laux, P. S. Cohen, and T. Conway.
Carbon nutrition of Escherichia coli in the mouse intestine.
2004. Proc. Nat. Acad. Sci. 101: 7427-7432 .pdf
PubMed
Hentges, D. J., J. U. Que,
et al. (1984). "The influence of streptomycin on colonization in
mice." Microecol Theor 14: 53-62.
Miller, C. P., and M. Bohnhoff.
1963. Changes in the mouse's enteric microflora associated with enhanced
susceptibility to Salmonella infection following streptomycin-treatment.
J. Infect. Dis. 113:59-66.
Miranda, R.
L., T. Conway, M. P. Leatham, D. E. Chang, D. L. Tucker, W. E. Norris,
J. H. Allen, S. J. Stevenson, D. C. Laux, and P. S. Cohen. 2004. Glycolytic
and gluconeogenic growth of Escherichia coli O157:H7 (EDL933)
and E. coli K-12 (MG1655) in the mouse intestine. Infect. Immun.
72: 1666-76. .pdf
PubMed
Møller, A.,
T. Conway, P. Nuijten, K. A. Krogfelt and P. S. Cohen. 2003. An Escherichia
coli MG1655 lipopolysaccharide deep-rough core mutant grows and
survives in mouse cecal mucus, but fails to colonize the mouse large
intestine. Infect. Immun. 71: 2142-2152. .pdf
PubMed
Sweeney, N.
J., P. Klemm, B. A. McCormick, E. Moller-Nielsen, M. Utley, M. A. Schembri,
D. C. Laux, and P. S. Cohen. 1996. The Escherichia coli K-12
gntP gene allows E. coli F-18 to occupy a distinct
nutritional niche in the streptomycin-treated mouse large intestine.
Infect. Immun. 64:3497-3503.
Sweeney, N.
J., D. C. Laux, and P. S. Cohen. 1996. Escherichia coli F-18
and K-12 eda mutants do not colonize the streptomycin-treated
mouse large intestine. Infect. Immun. 64:3504-3511.


