
Home
Abstract
Introduction
Theoretical Background
The Interactive Model
Rationale and Hypotheses
Method
Discussion
References
Appendices
The Wild Card
Effect and Military Retention:
Latent Social Identities in an
Interactive Organizational Commitment Model
Rationale and Hypotheses
Plotting the Wild Card
Large amounts of research have been confounded by the wild card effect on antecedents to commitment. Much additional research has been dedicated to identifying the wild card in play within organizational commitment models. Disagreement over the accuracy of a two-component model or a three-component model of commitment centers on one hand on arguing a propensity to commit based on certain sets of goals and values, and on the other hand, on proposing a normative commitment based on certain goals and values. A single variable that could operate in both conditions would be helpful.
The authors suggest that latent social identity is the wild card that determines levels of propensity to commit to an organization, an occupation, or both, and that interacts with affective and calculative commitment imposing a normative effect. This paper introduces a new model of commitment that demonstrates the wild card theory, beginning with a "specific propensity model" and building to a fully interactive system.
H1. General propensity to commit is plotted along an x-axis representing latent social identity.
In Figure 1, the continuum between the local and the cosmopolitan forms the x-axis. The authors propose that plotting the individual's location on the continuum will give a rough approximation of the individual's "general propensity to commit."
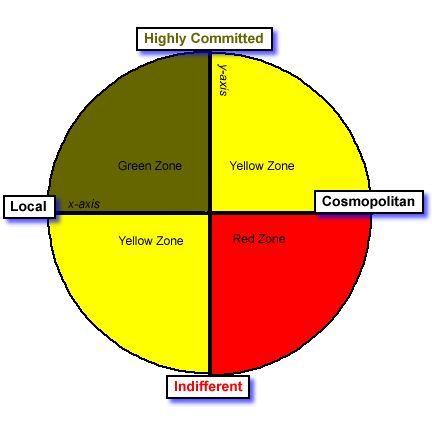
Figure 1. The Specific Propensity Model.
Existing instruments for measuring local and cosmopolitan orientation are based on Gouldner's (1957), Bennis et al.'s (1958), and Glaser's (1963) constructs. Therefore, they require a specific organization and a specific occupation as targets of the individual's commitment. It would be useful to be able to identify this propensity independent of specific organizations and occupations. Using the broader local and cosmopolitan traits identified by Merton (1957) (Appendix A) and Toonies (1940) (Appendix B), the authors constructed a Latent Identity Questionnaire (LIQ) (Appendix C) to measure latent social orientation.
H2. Specific propensity to commit is plotted by adjusting the y-axis to represent the organization's latent identity.
.However, while this addresses a general propensity to commit (the antecedent wild card), it does not account for the normative effect (the component wild card). The authors suggest that the convergence of individual latent identity values and organizational latent values create the normative effect. Therefore, plotting the organization's location on the x-axis will give a rough approximation of the organization's latent identity. Comparing the proximity of the individual's latent identity to the organization's latent identity will give a rough approximation of the individual's "specific propensity to commit." The closer the individual's plot on the line falls to the organization's plot, the higher the level of organizational fit.
Using the types of local and cosmopolitan traits that were incorporated into the LIQ, the authors constructed the Organizational Identity Questionnaire (OIQ) (Appendix D) to measure the organization's latent social orientation.
The latent social identity of the organization influences its needs and makeup. This can be represented on Figure 1 by sliding the y-axis either left or right to the spot on the x axis where the organization's latent identity was plotted. This helps to shape the field, providing a graphic representation of the organization's needs and makeup, and its tolerance for extreme organizational or occupational commitment. For example, Figure 2 represents a highly local organization. It can tolerate only a limited number of extreme cosmopolitans, but provides a good fit for extreme locals. Figure 3 represents a highly cosmopolitan organization. It can tolerate only a small number of extreme locals, but provides a good fit for extreme cosmopolitans.
Figure 2. A highly local organization.
Figure 3. A highly cosmopolitan organization.
H3. Actual commitment can be roughly plotted from the specific propensity to commit on the x-axis with the combined levels of affective and calculative commitment on the y-axis.
The y-axis running between the highly committed and the indifferent (Figure 1) represents levels of commitment. The highly committed, located part way along the local-to-cosmopolitan continuum, is highly committed to both an organization and an occupation. The indifferent is found at the same location along the local-to-cosmopolitan continuum, but is committed to neither the organization nor the occupation.
The authors suggest that by measuring levels of affective and calculative commitment using the Mowday, Steers, and Porter (1979) Organizational Commitment Questionnaire (OCQ), and plotting that point in conjunction with the individual's specific propensity to commit, it is possible to plot a rough estimate of an individual's actual organizational commitment.
Individuals plotted in the green zone have the strongest organizational commitment. Those in the upper right yellow zone have moderate organizational commitment and strong occupational commitment. Those in the lower left yellow zone have moderate organizational commitment and low occupational commitment. Those in the red zone have low organizational and moderate to low occupational commitment. Unless there is a change in circumstances, they are on their way out of the organization.
Fortunately, many factors interact within an organization to increase and decrease commitment over time. It would be useful to have a model that demonstrates how those factors interact to influence commitment.

DoD Short Course in
Communication
Class 01A
December 7, 2000