Creating Value Added Maps
Homepage | Introduction
| Map Features |
Feature Measurements |
Coding
Value Added Maps | Elevation
Maps | Soil Survey Maps
| Soil Attributes
Soil Characteristics
| Combining Strategy
| Process Map | Solution
Map
| It's More Than Just A Map...!
Value Added Mapping techniques are deliberate enhancements
to map cartography which are applied to intensify existing, (but not always
apparent) physical, biological, and/or social-cultural features.
Value added mapping techniques are learned skills that help isolate, organize,
extract, or combine map features. These skills are particularly useful
when preparing or organizing information for Graphic Overlay. |
 |
Value Added Data Map sets are appropriate collections of
map and attribute information that collectively relate the significant
map elements for a given area. There are potentially thousands of
data set variations, each particularly adapted to the needs of the Graphic
Overlay Method user.
Typical uses for the Value Added Topographic
and Soils maps
Topography Value
added elevation maps portray the relative topographic elevation above mean
sea level. The graphic portrayal of the characteristics of land relief
represented as topological (contour) lines on a map. Topographic
or Elevation maps are used in determining:
-
Elevation at which flooding might occur.
-
Elevation at which snow accumulates.
-
Avalanche prevention strategies.
-
Automobile traffic routing.
-
Emergency evacuation planning.
-
Elevation at which trees stop growing.
-
Elevation at which breathing is difficult.
-
Depth of navigable waterways.
-
Effect of lake rise during flood season.
-
Effect of wetland loss.
Value added aspect maps characterize land solar orientation
in terms of North, South, East, or West. Aspect maps are effective in determining:
-
Soil moisture loss in agriculture and forestry.
-
Energy effeciency in housing allocations.
-
Indigenous vegetation habitats.
Value added slope maps depict the relative measure of topographic
steepness.
Slope maps are useful in determining:
-
Mass wasting potential.
-
Landslide and rockslide potential.
-
Avalanche potential.
-
Soil erosion potential.
Value added landform maps are graphic characterizations of
the unique land surface qualities. Landscapes are usually a mosaic
of depositional, diastrophic, erosional, or residual classifications.
Landform maps are worthwhile for determining:
-
Physiologic regions.
-
Land surface roughness.
-
Indigenous vegetation and habitat.
-
Visual character.
-
Regional identity.
SOILS The regolith
or surface materials of the landscape supports the growth of plants.
Soil maps are perhaps the most serviceable in beginning GIS application.
The attribute tables for soil information is generally clear, and have
a structure that can easily be directed in GIS to produce very practical
maps such as:.
Value added depth to bedrock maps are estimates of soil
thickness above bedrock affecting:
-
The cost of building foundation construction.
-
The cost of road bed construction.
-
The vegetative diversity.
-
The indirect visual character.
Value added depth to watertable map estimate the soil thickness
above ground wholly saturated with water affecting:
-
The cost of building construction.
-
The cost of road construction.
-
The vegetative vigor and diversity.
Value added soil texture (soil class) maps incorporate the
unified soil classification system by segregating soil components into
sand, silt, clay divisions. This classification system is useful in determining:
-
Appropriateness for building materials.
-
Material incorporation potential within the construction
process.
Value added soil permeability maps display the ability of
water to pass thru soil and affecting:
-
The interval in agricultural cultivation.
-
The timing in agricultural irrigation.
Value added percolation rate maps demonstrate the measurement
of time for water to pass thru the small pores within soils effecting,
for example, septic tank suitability studies.
Value added engineering constraints maps delineate negative
characteristics of land and water features that can / might / will affect
the planning phase of engineering. Engineering constraints maps influence
the construction process and help determine the relative difficulty associated
with the actual construction costs.
Value added availability for construction materials sources
of on site (or near by) construction materials such as topsoil, sand &
gravel, and road fill. These maps help reduce over all costs, and provide
for secondary opportunities in visual amenities, recreational opportunities,
and wildlife habitat.
Other Possible Value Added Maps:
(not used in the coming example)
-
HYDROLOGY The water components of the landscape.
-
VEGETATION The vegetative agricultural and silvacultural
landscape components.
-
HISTORICAL The cultural elements of the landscape.
-
EXISTING LAND USE The current uses or activities of
the landscape.
-
PUBLIC and PRIVATE UTILITIES Municipal and
private utility services such as electric, gas, sewer, and water.
-
EXISTING ZONING The legal land activity partitions.
-
TRANSPORTATION All methods of human circulation.
-
ACCESSIBILITY How far is the particular activity or
location from another activity or location.
Keep in Mind...,
-
Value is a descriptive term that classifies the relative
worth, utility, or importance of selected map features within a
given area.
-
Value is also a numeric quantity, (assigned or computed),
that can define the amount, extent, or specific measurement of any
given location.
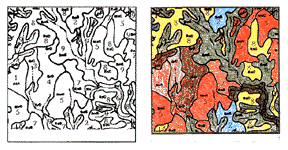
The Elevation
Maps are the first of two examples that will demonstrate value added
maps. Or look at the Soil Survey Maps,
(the second map in this example).
Return to the Graphic
Overlay Homepage
All contents copyright (C)
1993-1999, D. Fehler All
rights reserved.
|
