The map (below) is Section 28 of the United States Soil
Conservation Service, United States Department of Agriculture, (SCS, USDA)
Soil Association map in Rapides Parish, Louisiana. Similar paper
booklets, and accompanying maps, are available for most areas in the United
States. The original (paper) map scale is 1:20,000.
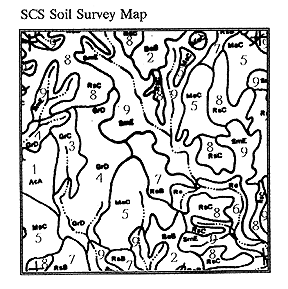 Numbers (1-10) have been added to the survey map for a second
easy reference. Yes, this is a "paint by numbers" coding scheme that
assigns a value to a specific land area based on accompanying tables of
scientific information.
Numbers (1-10) have been added to the survey map for a second
easy reference. Yes, this is a "paint by numbers" coding scheme that
assigns a value to a specific land area based on accompanying tables of
scientific information.
|
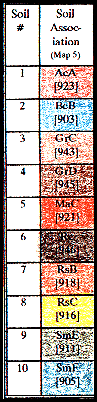 The three digit numbers in brackets [999] reference Berol
Prismacolor pencils colors.
The three digit numbers in brackets [999] reference Berol
Prismacolor pencils colors.
|