|
Coding Map Information Numeric, Symbolic, and Color Coding To be functional to GIS, map information must be organized and segregated by appropriate categories that are specific to each earth resource or human activity. For a particular category to effectively exist in the reality of GIS it must be symbolized by the closest approximation, and then assigned the appropriate "code value." Coding schemes are the essential component for the clear understanding and appropriate homogeneous delineating of landscape components. Obviously, particular coding schemes lend themselves to particular applications.
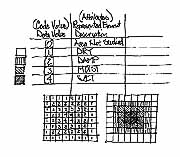
Typical GIS coding schemes:
Coding Scheme Examples The following are the two most basic category listings that characterize the land resources, the water resources, and human activities. This listing is sometimes called Land Cover, Land Type, Land Utilization, Land Activity, and (most commonly) Landuse. To be useful to geographic mapping efforts, all mapped features must be part of a larger classified scheme. For example: Resource Inventory Land Use and Land Cover
[2] Agricultural land [3] Range land [4] Forest land [5] Water [6] Wetland [7] Barren land [8] Tundra [9] Perennial snow or ice (Level I), Urban Renewal Administration (URA)
[2] Manufacturing [3] Manufacturing (continued) [4] Transportation, communication, and utility [5] Trade [6] Services [7] Cultural, entertainment, and recreational [8] Resource production and extraction [9] Undeveloped land and water areas The USGS category [1] contains the majority of the URA listings [1] through [9], and conversely, the URA category [9] contains the majority listings for the USGS [1] through [9]. Needed map information must often be gathered and organized from various sources. Before maps are useful to the Graphic Overlay Method they must be "prepaired." Not all maps are currently available in electronic format. Some information must be prepared by hand. Here are some useful examples of Value Added Maps. Return to the Graphic Overlay Homepage
|